

// C# Advent Calendar 2018 の 23 日目の記事です。
デバッガーのようなものを自作してみました。
動機
- 普段は Visual Studio を使っているが、デバッグ時に手動でステップ実行するのが面倒
- ループなどでステップ数が多い場合
- 分岐の様子や変数の状態を軽くチェックしたい場合
解決案
- ステップの時間間隔だけを指定して、デバッガーを自動で実行させる
- 変数の一覧が表示される
- 時間間隔をリアルタイムで調節できる
- .NET Compiler Platform (Roslyn) の構文解析の機能を使い、各ステップの間にデバッグ用のコードを差し込めば実現できそう
結果
というわけで、WPF でプロトタイプ「Tick-tack Debugger」を作ってみた結果、このようになりました。
例として、ニュートン法で平方根を求めています。 (クリックで拡大)
解説
以下は概略の技術解説です。
WPF アプリを作成する前に、まず .NET Framework 上のコンソール アプリで実験してみます。
C# の構文解析を使うには、NuGet で Microsoft.CodeAnalysis.CSharp をインストールします。
デバッグ対象となるソースコードにデバッグ コードを挿入し、それを動的にコンパイルして実行する、という方針です。
コンソール アプリのソースコードを以下に示します (全体のソリューションは SyntaxTreeSample にあります)。
| using System; | |
| using System.CodeDom.Compiler; | |
| using System.Collections.Generic; | |
| using System.IO; | |
| using System.Linq; | |
| using System.Text; | |
| using System.Threading; | |
| using DebuggerLib; | |
| namespace DebuggerConsole | |
| { | |
| class Program | |
| { | |
| const string SourcePath = @"..\..\..\NumericConsole\Program.cs"; | |
| const string GeneratedPath = @"Program.g.cs"; | |
| static void Main(string[] args) | |
| { | |
| // Generates the code for debugging. | |
| var sourceCode = File.ReadAllText(SourcePath); | |
| var generatedCode = SyntaxHelper.InsertBreakpoints(sourceCode); | |
| File.WriteAllText(GeneratedPath, generatedCode, Encoding.UTF8); | |
| // Compiles and loads the assembly. | |
| var provider = CodeDomProvider.CreateProvider("CSharp"); | |
| var compilerOption = new CompilerParameters(new[] { "System.Core.dll", "DebuggerLib.dll" }) { GenerateExecutable = true }; | |
| var compilerResult = provider.CompileAssemblyFromFile(compilerOption, GeneratedPath); | |
| if (compilerResult.Errors.HasErrors) return; | |
| // Registers the action for breakpoints. | |
| DebugHelper.InfoNotified += (spanStart, spanLength, variables) => | |
| { | |
| Console.WriteLine(string.Join(", ", variables.Select(v => $"{v.Name}: {v.Value}"))); | |
| Console.WriteLine(sourceCode.Substring(spanStart, spanLength)); | |
| Thread.Sleep(1000); | |
| }; | |
| // Calls the Main method. | |
| var entryPoint = compilerResult.CompiledAssembly.EntryPoint; | |
| entryPoint.Invoke(null, new object[] { new string[0] }); | |
| } | |
| } | |
| } |
| using System; | |
| using System.Collections.Generic; | |
| using System.Linq; | |
| using Microsoft.CodeAnalysis; | |
| using Microsoft.CodeAnalysis.CSharp; | |
| using Microsoft.CodeAnalysis.CSharp.Syntax; | |
| using Microsoft.CodeAnalysis.Text; | |
| using DebugStatement = System.ValueTuple<Microsoft.CodeAnalysis.CSharp.Syntax.StatementSyntax, string[]>; | |
| namespace DebuggerConsole | |
| { | |
| public static class SyntaxHelper | |
| { | |
| public static string InsertBreakpoints(string sourceCode) | |
| { | |
| var root = ParseText(sourceCode); | |
| var method = root.DescendantNodes() | |
| .OfType<MethodDeclarationSyntax>() | |
| .FirstOrDefault(m => m.Identifier.ValueText == "Main") | |
| ?? throw new FormatException("The Main method is not found."); | |
| var statements = DetectStatements(method); | |
| var result = sourceCode; | |
| foreach (var (statement, variables) in statements.Reverse()) | |
| { | |
| var (span, debugIndex) = GetSpan(statement); | |
| result = result.Insert(debugIndex, $"DebugHelper.NotifyInfo({span.Start}, {span.Length}{ToParamsArrayText(variables)});\r\n"); | |
| } | |
| return result.Insert(root.Usings.FullSpan.End, "using DebuggerLib;\r\n"); | |
| } | |
| public static CompilationUnitSyntax ParseText(string text) | |
| { | |
| var tree = CSharpSyntaxTree.ParseText(text); | |
| var diagnostics = tree.GetDiagnostics().ToArray(); | |
| if (diagnostics.Length > 0) throw new FormatException(diagnostics[0].ToString()); | |
| return tree.GetCompilationUnitRoot(); | |
| } | |
| public static DebugStatement[] DetectStatements(MethodDeclarationSyntax method) | |
| { | |
| var statements = new List<DebugStatement>(); | |
| DetectStatements(method.Body, statements, new List<(string, SyntaxNode)>()); | |
| return statements.ToArray(); | |
| } | |
| static void DetectStatements(SyntaxNode node, List<DebugStatement> statements, List<(string name, SyntaxNode scope)> variables) | |
| { | |
| // Adds variables. | |
| if (node is VariableDeclarationSyntax varSyntax) | |
| { | |
| var varNames = varSyntax.Variables.Select(v => v.Identifier.ValueText).ToArray(); | |
| var scope = ((node.Parent is LocalDeclarationStatementSyntax) ? node.Parent : node) | |
| .Ancestors() | |
| .First(n => n is StatementSyntax); | |
| variables.AddRange(varNames.Select(v => (v, scope))); | |
| } | |
| // Maps variables to the statement. | |
| if ((node is StatementSyntax statement) && | |
| !(node is BlockSyntax) && | |
| !(node is BreakStatementSyntax)) | |
| statements.Add((statement, variables.Select(v => v.name).ToArray())); | |
| // Recursively. | |
| foreach (var child in node.ChildNodes()) | |
| DetectStatements(child, statements, variables); | |
| // Maps variables to the last line of the block. | |
| if (node is BlockSyntax block) | |
| statements.Add((block, variables.Select(v => v.name).ToArray())); | |
| // Clears variables out of the scope. | |
| if (node is StatementSyntax) | |
| for (var i = variables.Count - 1; i >= 0; i--) | |
| if (variables[i].scope == node) | |
| variables.RemoveAt(i); | |
| else | |
| break; | |
| } | |
| static (TextSpan, int) GetSpan(StatementSyntax statement) | |
| { | |
| switch (statement) | |
| { | |
| case ForStatementSyntax f: | |
| var span = new TextSpan(f.ForKeyword.Span.Start, f.CloseParenToken.Span.End - f.ForKeyword.Span.Start); | |
| return (span, statement.FullSpan.Start); | |
| case BlockSyntax b: | |
| return (b.CloseBraceToken.Span, b.CloseBraceToken.FullSpan.Start); | |
| default: | |
| return (statement.Span, statement.FullSpan.Start); | |
| } | |
| } | |
| static string ToParamsArrayText(string[] variables) => | |
| string.Concat(variables.Select(v => $", new Var(\"{v}\", {v})")); | |
| } | |
| } |
SyntaxHelper クラスでは、デバッグ対象の C# ソースコードを構文ツリー (SyntaxTree) に変換して走査し、
各ステートメントの前にデバッグ用のコード行を挿入していきます。
CSharpSyntaxTree.ParseText メソッドを使うことで、ソースコードを構文ツリーに変換できます。
また、メソッド・ステートメント・式など、すべてのノードを表す親クラスは SyntaxNode クラスであり、
- Parent プロパティ: 親
- Ancestors メソッド: 祖先
- ChildNodes メソッド: 子
- DescendantNodes メソッド: 子孫
が存在することを知っておけば、だいたいの探索ができるでしょう。
この他に、デバッグ用のコードから呼び出されるメソッドを定義するクラス ライブラリとして DebuggerLib を作成しています。
各ステートメントの位置、およびその直前で存在する変数とその値を通知するために、このライブラリを経由させます。
Program クラスでは、生成されたデバッグ用のソースコードをファイルに保存したら、
System.CodeDom.Compiler 名前空間の CodeDomProvider を使ってこれをコンパイルし、
そのエントリ ポイント (Main メソッド) を呼び出します。
また、デバッグ コードが実行されたときのイベントハンドラーを登録しておき、
Thread.Sleep メソッドを使って、指定した時間だけ停止させます。
これで、デバッグ対象の元のソースコードが次の Program.cs だとすると、
デバッグ用のソースコードとして下の Program.g.cs が生成されます。
| using System; | |
| namespace NumericConsole | |
| { | |
| class Program | |
| { | |
| static void Main(string[] args) | |
| { | |
| // Square root by the Newton's method. | |
| var a = 5.0; | |
| var x = a; | |
| for (var i = 0; i < 100; i++) | |
| { | |
| var xi = (x + a / x) / 2; | |
| if (x == xi) break; | |
| x = xi; | |
| } | |
| Console.WriteLine(x); | |
| } | |
| } | |
| } |
| using System; | |
| using DebuggerLib; | |
| namespace NumericConsole | |
| { | |
| class Program | |
| { | |
| static void Main(string[] args) | |
| { | |
| DebugHelper.NotifyInfo(188, 12); | |
| // Square root by the Newton's method. | |
| var a = 5.0; | |
| DebugHelper.NotifyInfo(214, 10, new Var("a", a)); | |
| var x = a; | |
| DebugHelper.NotifyInfo(240, 29, new Var("a", a), new Var("x", x)); | |
| for (var i = 0; i < 100; i++) | |
| { | |
| DebugHelper.NotifyInfo(302, 25, new Var("a", a), new Var("x", x), new Var("i", i)); | |
| var xi = (x + a / x) / 2; | |
| DebugHelper.NotifyInfo(347, 19, new Var("a", a), new Var("x", x), new Var("i", i), new Var("xi", xi)); | |
| if (x == xi) break; | |
| DebugHelper.NotifyInfo(384, 7, new Var("a", a), new Var("x", x), new Var("i", i), new Var("xi", xi)); | |
| x = xi; | |
| DebugHelper.NotifyInfo(405, 1, new Var("a", a), new Var("x", x), new Var("i", i), new Var("xi", xi)); | |
| } | |
| DebugHelper.NotifyInfo(422, 21, new Var("a", a), new Var("x", x)); | |
| Console.WriteLine(x); | |
| DebugHelper.NotifyInfo(453, 1, new Var("a", a), new Var("x", x)); | |
| } | |
| } | |
| } |
作成したコンソール アプリを実行すると、次の図のようになります (時間間隔は 0.3 秒)。
以上をもとに、WPF アプリでデバッグ ツールを作成しました。
左側の C# ソースコードの部分は TextBox で、編集もできます。
デバッグ実行時は、各ステートメントを選択状態にすることでハイライトしています。
右側の変数一覧が表示される部分は DataGrid です。
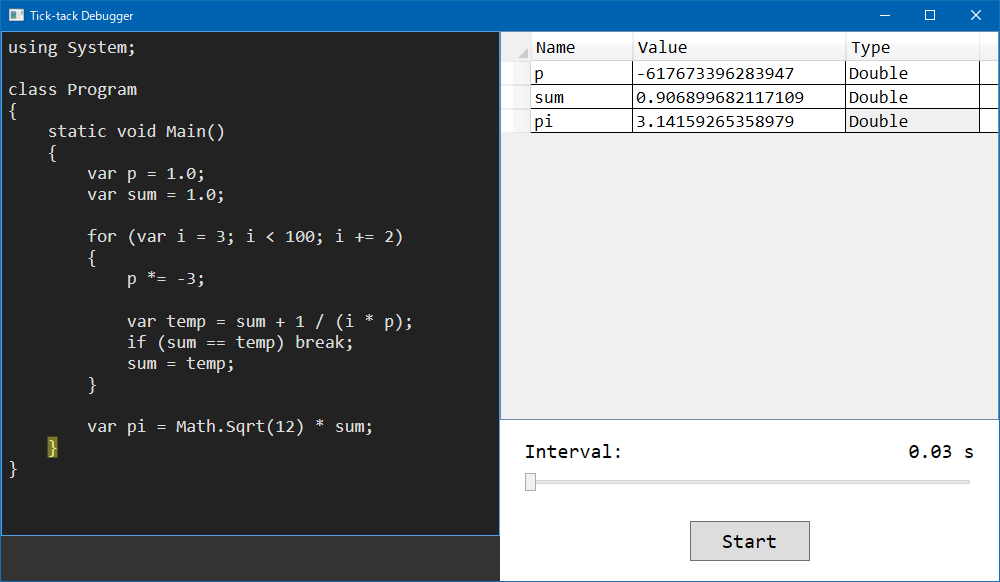
(図は円周率を求める例)
今回は上記の方法でプロトタイプを作ってみましたが、
デバッグ コードの挿入やコンパイルに関しては、よりスマートな方法があるのではないかと思います。
注意点
- 考えられうるすべてのステートメントには対応できていません。また、Main メソッドしか構文解析していません。
- コンパイル時に生成されるアセンブリ (EXE) は、
%TEMP%フォルダー (ユーザーのAppData\Local\Temp) に保存されていきます。 - TextBox で、IsInactiveSelectionHighlightEnabled を True に設定しても利かないことがあります。
また、選択状態のハイライトがずれることがあります。
RichTextBox で Run などを使うのがよいかもしれません。
作成したサンプル
バージョン情報
- .NET Framework 4.7
- Microsoft.CodeAnalysis.CSharp 2.10.0
- ReactiveProperty 5.3.2


コメントを残す